As an economist, I am a data junkie. I constantly peer over scads of numbers and other information to assess what is going on and how our economy might evolve.
Last week, “Marketplace,” the ubiquitous public-radio business-focused broadcasting concern, released its latest survey carried out by Edison Research, which highlights Americans’ concerns about the state of the economy. The results are quite interesting. For those who are also genuine data junkies, the raw intel can be found at bit.ly/2epRECQ. The rather complicated Economic Anxiety Index has risen during the last year, from 20 to 36, meaning that many more Americans have significant concerns about their jobs, paying their mortgage, and saving for retirement.
Sadly, 25 percent of those surveyed completely distrust economic data compiled by the federal government. Interestingly, this distrust is split along political lines, with half of Trump supporters and a mere five percent of Clinton supporters holding the cynical view that government stats are trumped up.
A majority of citizens — 62 percent — felt that the economy itself is somehow rigged in favor of various interest groups. Both Democrats and Republicans feel that the economic deck is stacked in favor of the wealthy, politicians, bankers, and large corporations. However, while Democrats also feel that the economy favors whites, Republicans instead feel that the economy favors people who receive government assistance.
These are feelings, as opposed to reality. My first comment would be to assure readers that the economic data we receive from the Fed, the Bureau of Economic Analysis, the Bureau of Labor Statistics, the U.S. Census Bureau, and so forth are as good as it gets. To suggest otherwise is to toss rational reasoning and empirical evidence into the trash bin.
The economists who compile data are career scientists and statisticians who do not operate as partisan puppets. Further, many of the numbers they produce are also estimated by private think tanks and can therefore be cross-checked for credibility. The presumption that economic statistics are somehow fudged to facilitate a subterfuge of some sort is frankly preposterous.
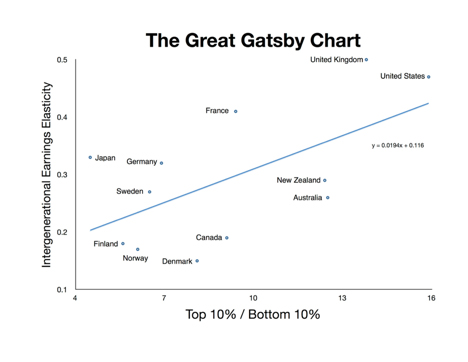
But is the economy “rigged” in favor of the wealthy? The word “rigged” is not an economic term. It conveys a broad range of possible concepts which might fall under the rather wide umbrella of “rigging.” One good starting point is to recall the so-called “Great Gatsby chart,” pictured below, that we examined in this column a few years ago.
The chart, first constructed by Canadian economist Miles Corak, and named by Princeton University labor economist Alan Krueger, shows the relationship between income inequality on the horizontal (X) axis and economic upward mobility on the vertical (Y) axis.
In compiling my own version of this chart, I chose to use the ratio of the top 10 percent of wage earners to that of the bottom 10 percent of earners as the measure of income inequality. For example, in Finland, the top decile earns about five-and-a-half times as much as those in the bottom decile. In Canada, the ratio is around 8-to-1. In the U.S., the top decile earns on average a whopping 16 times what those at the bottom receive.
The vertical axis shows a measure of “intergenerational earnings elasticity.” This particular elasticity shows how likely someone born into an income cohort will remain in that cohort. A high number (closer to 1) means that if one is born poor one will remain poor, and if one is born rich one will remain rich. An elasticity close to zero means that one’s status at birth has little bearing on one’s future outcome. Thus, a lower score in the chart means high upward mobility, and vice versa. Put another way, a low elasticity on the Y-axis is evidence of equal opportunity. A high elasticity would give evidence of unequal opportunity, or a “rigged” economy.
As a note, Corak used census data from around the world to construct his elasticity, following individuals from birth to retirement over a period of two generations. He is the world’s foremost authority on intergenerational economic data.
Two things emerge from this chart. First and foremost, there appears to be a statistically significant relationship between inequality and upward mobility. Countries such as the U.S. and U.K. that have very high income inequality also have very low upward mobility. Similarly, nations such as Canada, Finland, Norway, and Denmark have low inequality and high upward mobility.
Often I have heard the statement “I believe in equal opportunity but not equal outcome.” The Great Gatsby chart informs us that equal opportunity (a low score on the chart) is associated with more equal outcome. The two go hand in hand. If we have more equal opportunity, on average, we have more equal outcomes.
A second observation is readily apparent. The “American dream” is the ideal that every U.S. citizen can rise to a level of success through hard work and determination regardless of race, creed, or color. The Great Gatsby chart informs us that to achieve the American dream, one must move to Finland, Canada, or somewhere other than the USA.
Next week, we will examine a few reasons why the U.S. is in such a poor place on the chart.
(Marcus Hutchins is a former economist, treasury-bond arbitrage trader, and hedge fund manager. He retired to Southport in 1997, where he resides with his wife, Andrea, and youngest daughter, Abbey. He welcomes feedback at coastaleconomist@me.com.)


