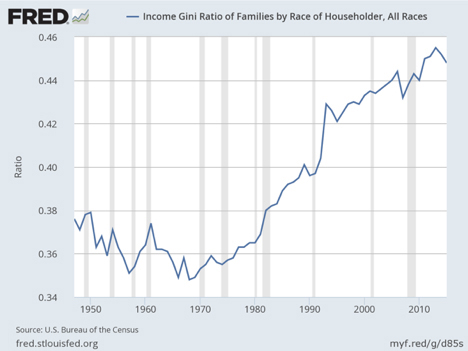
This chart shows the Gini coefficient, which measures the dispersion of income, in the U.S. since 1947. The greater the Gini, the greater the inequality.
Every 12 hours and 26 minutes billions of gallons of water move into or out of the Gulf of Maine. Most locations around the world see their coastline gain about a meter of water between low and high tides. In contrast, we, who live along the Gulf of Maine, see anywhere from 3 to 17 meters of water depending on location.
The Bay of Fundy is the only place on the planet where tides reach the height of 17 meters. Two chief characteristics cause this unique phenomenon.
The most important factor affecting our local tides relates to resonance. Perhaps the easiest way to understand this anomaly is to picture a parent helping a child on a swing. The child will go higher and higher if the parent gives a push just as the child has turned directions at the top of the cycle.
If the parent pushes too soon or too late the swing may slowdown. But if timed according to the resonance of the swing’s movement, the child goes high.
This is exactly how our Gulf of Maine works. If we were to somehow generate a huge wave at the mouth of the gulf, it would take about 12-and-a-half hours for the wave to resonate to the tip of the Bay of Fundy, the same time as the tide cycle.
In other words, the size and length of the Gulf is perfectly constructed so that the resonance of the water almost exactly corresponds to the phases of the moon created by the rotation of the earth and orbit of the moon. Just as the outgoing flow of water is about to flow back like the child’s swing, the water gets “pushed” by the next cycle of tidal flow thereby setting up a resonant boost.
The second factor has to do with the exact shape of the shoreline as well as the ocean floor. Once again, this has been designed to maximize the flow of water and its vertical impact down east.
Now, I know what you are thinking. This is supposed to be the Coastal Economist column. By now you are starting to wonder whether this isn’t perhaps some nature column. Actually, this has an analogy within our modern economy.
In 1963 President Kennedy popularized an old New England adage, “a rising tide lifts all boats.” The phrase has come to be used to promote the idea that a strengthening economy benefits all people. Therefore, the argument goes, we should focus our macroeconomic policies on growth. That is the theory.
Of course, our actual economic experience since 1963 casts significant doubt on the validity of the “rising tide” theory. In actuality, our economy acts a great deal like our local tides. A rising economy lifts our households very unevenly.
Our economy runs through business cycles of booms and busts which are somewhat akin to our tides, albeit with less predictability.
Just as our tides lift the boats in Boothbay Harbor three meters while raising the fleet in Five Islands, Nova Scotia 15 meters, our economic expansions create financial flows, movements of income which lift most households a little but a few by vast amounts.
Today’s graph shows the distribution of income in the U.S. since 1947. The Gini coefficient measures the dispersion of income. The greater the Gini, the greater the inequality.
To put this number in perspective, while the U.S. has a Gini of about 45, Finland is at 27, Canada at 33.5, and Russia at 41. Within the Organisation for Economic Co-operation and Development or OECD, a club of 35 advanced nations, only Chile and Mexico exceed the inequality of the U.S. as measured by the Gini coefficient.
Another measure used by the OECD examines the percent of the population which earns less than half of that nation’s median income. By that measure 17.5 percent of the U.S. population lives on less than $28,000 per year.
Only Israel has a worse performance than the U.S. at 18.6 percent. In contrast, Iceland has sculpted the contours of its economy so as to insure that a mere 4.6 percent of its population is below that measure of poverty.
Mankind has little choice but to accept the huge tides in our gulf which lift all boats by significantly different amounts. It would be most imprudent and impractical to alter the length and shape of the gulf.
However, we do have control over the way we channel the flow of funds to households. Through public policies we establish the distribution we desire.
Our chart shows a more-or-less flat period during the 1950s and 60s followed by sharp rises after recessions from the Reagan era until today. We will examine this history in a bit more detail next week.
(Marcus Hutchins is a former economist, treasury-bond arbitrage trader, and hedge fund manager. He retired to Southport in 1997, where he resides with his wife, Andrea, and youngest daughter, Abbey. He welcomes feedback at coastaleconomist@me.com.)


